Database Scalability: Contention and Crosstalk
Do more with less
New engineers might not know and experienced engineers might not believe that database systems do not and cannot scale gracefully to 100% system capacity but, rather and counterintutively, exhibit retrograde performance at some point less than 100% system capacity. The reasonable presumption is:
We presume that a database can scale to almost 100% of system capacity, and max performance is a small fraction at the very top (right, orange slice) because, after all, the system itself needs some resources to run itself. But the reality of database scalability is far less optimistic:
Most mature database systems (like MySQL) are so efficient at the low end of performance that they are effectively idle (gray slice), and the normal range of capacity (green slice) uses somewhere between 15% to 65% of system capacity. After that, max performance (orange slice) is a smaller zone of acceptable performance: about 65% to 75%. When operating at max performance, the database begins to exhibit one or more signs of performance and scalability limits:
- Increased 95th or 99th percentile response time
- Increased request timeouts
- Flatline metrics or whipsaw metrics or both
- Decreased high-level throughput
- Inexplicable slowness
Before I dive into those and retrograde performance, let me give you the TL;DR and answer to “why”:
Practical Scalability Analysis with the Universal Scalability Law
Download and carefully read that e-book. It explains and proves why.
Signs of Performance and Scalability Limits
The first sign is usually the literal first sign: increased 95th or 99th percentile response time. A well-designed system running on a mature database system will begin to respond more slowly at max performance for the simple, intuitive reason: the system is struggling to respond to all queries; it’s still working, just more slowly. This is usually not surprising; engineers expect this.
The second sign, increased request timeouts, is also a result of a well-designed system. If response time becomes too high then timeout, don’t leave user waiting too long. This is usually not surprising; engineers expect this (if they program timeouts into the system).
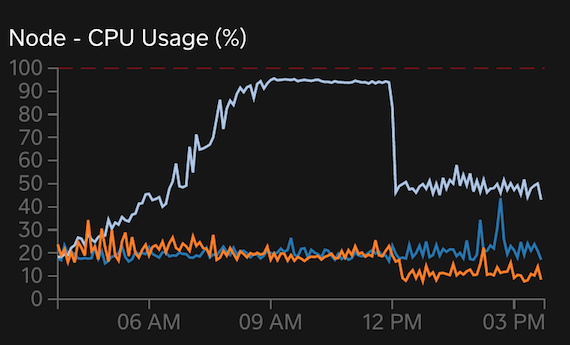
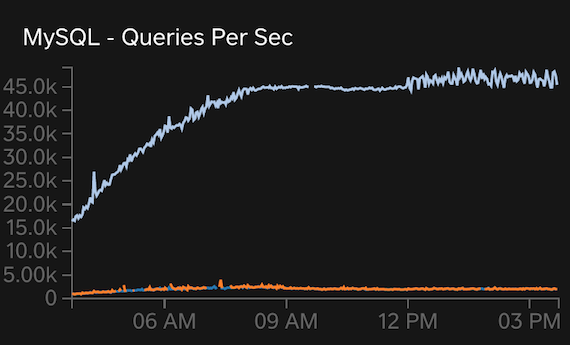
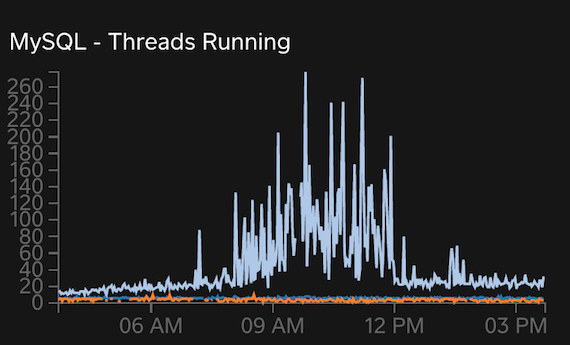
Flatline and whipsaw metrics are the fun and interesting signs. See if you can spot them in these graphs:


Of course, I’m joking: the flatlines in the first two graphs and the whipsawing in the last graph are obvious. These are from a real, high-end system running on dedicated physical hardware: 16 cores (32 virtual), 256 G RAM, and high-end storage. In short: powerful hardware. So what’s the problem? Past 20 threads running, real-world MySQL scalability becomes questionable. You might get a steady 30 threads running, but I wouldn’t expect more. You can push it far higher, as the last graph shows, but it won’t help or, worse, it will cause retrograde performance. 75% system capacity for this hardware is 24 cores, which fits reality for both general and MySQL scalability. We’ll come back to these charts later.
The last two signs, decreased high-level throughput and inexplicable slowness, often go hand-in-hand. Let’s pretend this system sends emails. At a high level, throughput is emails sent per second. At max performance, this metric will flatline or decrease because MySQL becomes a bottleneck. Hopefully, the system is instrumented well enough to isolate MySQL as the bottleneck vs. some other component (cache, code logic, network, storage, etc.). If that’s the case, then the engineer will know to look at MySQL metrics and most likely see other signs. But sometimes we’re not so lucky and the system is inexplicably slow. Other signs don’t always manifest (or they’re not measured, but that should be rare for production systems), and all engineers see is slowness everywhere and nowhere because they don’t know or believe that the database cannot scale gracefully to 100% system capacity. So they see, like in the graphs above, sustained high QPS and a lot of threads running, but the system is still slow. They think, “How can MySQL be working so hard yet doing so little?” The answer: Practical Scalability Analysis with the Universal Scalability Law.
Ironically, a system that can “work so hard yet do so little” at max performance is a well-designed and implemented system because it doesn’t crash and it mostly avoids retrograde performance. Less well-designed systems allow themselves to be pushed into the red–retrograde performance–and begin doing less and less until they crash.
Solution
When a system begins to exhibit signs of performance and scalability limits: stop. Don’t push it harder because it won’t help or, worse, it will cause retrograde performance. Truth is: there is no magical solution at this point. Rather, it might help to decrease load (throughput, requests, queue consumers, worker threads, etc.). This is the counterintuitive advice that’s often difficult to accept but after reading and understanding the math in Practical Scalability Analysis with the Universal Scalability Law you’ll understand why it’s true. The graphs above also demonstrate the proof: at 12pm load was decreased which caused a big drop in CPU usage but a slight increase in QPS! It also ended the whipsawing of threads running, and system engineers told me high-level throughput increased slightly, too! Proof that a system can do more with less.
The real, long-term solution is a true performance audit, deep-dive, and fix. That’s a huge topic. It could result in anything from query optimization to sharding to new, more powerful hardware.
Copyright 2025 Daniel Nichter


